A multi-outlet kitchen was closing the month by hand. Paper counts, invoices keyed one line at a time, and no clear picture of what anything actually cost. Seven distributors each sent their data in a different format.
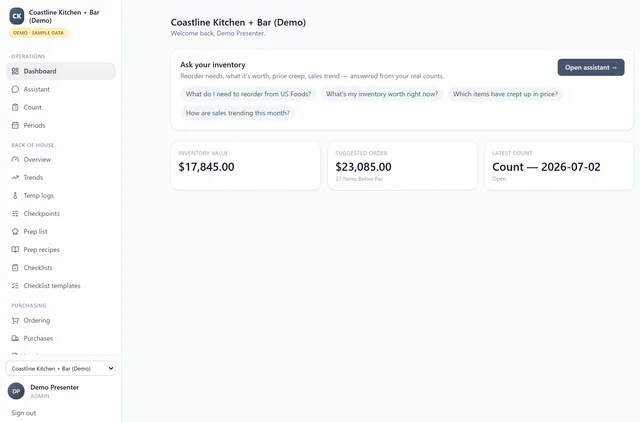
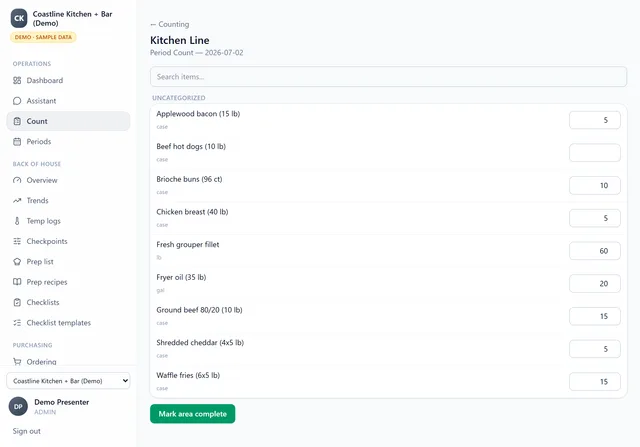
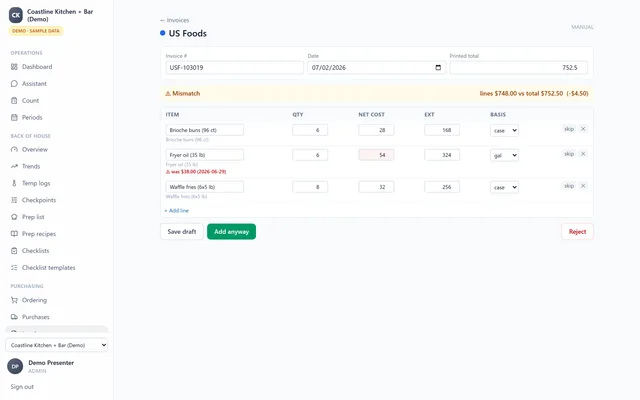
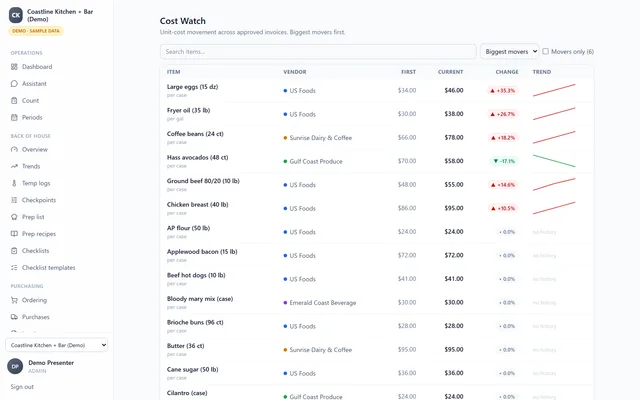
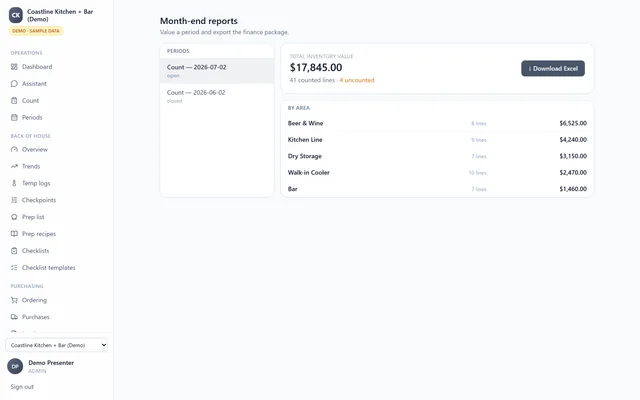
A hosted platform that runs the whole cycle. Staff count on an iPad with a tap-to-count interface, each working their own area at the same time, with every edit tracked. Invoices arrive two ways: clean vendor files are parsed instantly, and anything scanned or photographed is read automatically and held at a reconciliation gate before it posts. A Cost Watch view normalizes every item to a true per-unit price and flags real increases while ignoring the false spikes that promo pricing creates. Month-end finance export drops out as a finished workbook.
Next.js, Supabase (Postgres and auth), and Vercel, with automatic reading for scanned and photographed invoices. A thirteen-table schema, role-based access, and a full audit trail. Seven vendor formats parsed and validated, 146 duplicate item records cleaned up, and over 800 price points loaded and verified.
Month-end went from a manual slog to a guided process, with live cost visibility the operation never had before. That visibility is the foundation for catching the money leaks that used to go unnoticed.
Next.js · Supabase · Vercel · automatic invoice reading
← Back to work